How Do Scientists Measure the Speed at Which Humpback Whale Songs Are Repeated?
Humpback whales produce complex songs made up of recurring sounds, phrases, and longer sequences. Some parts of a song may be repeated several times, creating patterns that researchers can measure and compare.
But how do scientists determine how quickly a humpback whale repeats a particular sound or phrase They cannot rely on a general impression that a whale sounds fast or slow. Instead, researchers analyze underwater recordings, identify repeated vocal units, measure the time between them, and calculate repetition rates using consistent methods.
Understanding these measurements helps scientists describe whale vocal behavior more precisely. It also provides another way to investigate the sounds produced by humpback whales during their seasonal visits to Samaná Bay in the Dominican Republic.
What Is a Whale Song Repetition Rate?
A repetition rate describes how frequently a particular event occurs within a specified period. In humpback whale research, the event might be the production of a recognizable sound, a vocal unit, or a complete phrase.
Scientists must define what they are counting before calculating a rate. Counting individual sounds produces a different measurement from counting complete phrases or entire song sequences.
For example, suppose researchers identify 12 instances of a particular vocal unit during a recording lasting 60 seconds. The observed rate is:
12 repetitions ÷ 60 seconds = 0.2 repetitions per second.
That is equivalent to 12 repetitions per minute, provided the counting interval and the definition of a repetition remain consistent.
This is an illustrative calculation, not a measured repetition rate for humpback whales in Samaná Bay.
A clearly defined rate allows researchers to compare recordings without relying on subjective descriptions.
1. Recording Whale Songs With Hydrophones
The first step is obtaining an acoustic recording that captures the vocal patterns of interest.
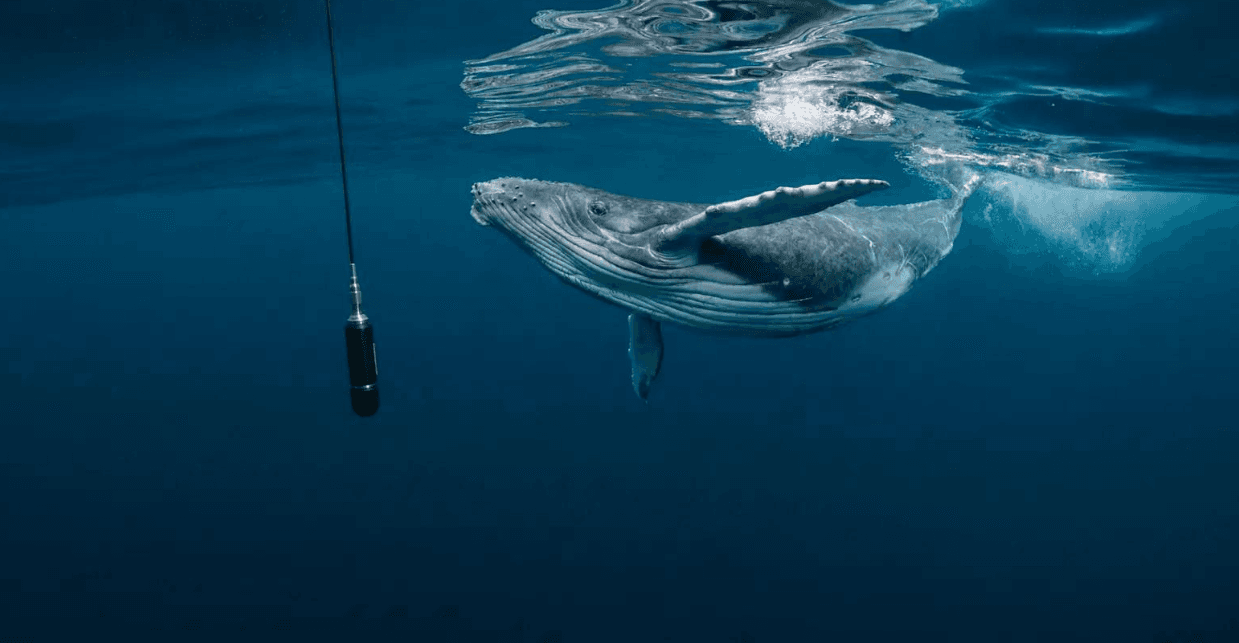
Scientists use hydrophones, which are underwater microphones designed to record sounds traveling through water. Depending on the study, equipment may be deployed from research vessels, installed at fixed locations, or used in other suitable configurations.
The recording method affects the quality of the resulting data. Researchers must consider background noise, the distance between the whale and the hydrophone, recording duration, and the possibility that several whales are singing at once.
A recording that contains frequent interruptions may make it difficult to count repetitions accurately. Likewise, overlapping vocalizations can cause researchers to mistake sounds from different singers for repetitions by one whale.
Scientists therefore assess recording quality before selecting a sample for detailed analysis.
2. Identifying the Sounds That Repeat
Before counting repetitions, researchers need to determine which sounds belong to the pattern being studied.
Humpback whale songs contain different acoustic units arranged into phrases and longer sequences. A researcher might focus on one recognizable unit, a particular phrase, or the recurrence of a larger sequence.
These are different levels of analysis. A short sound may occur many times within a phrase, while the complete phrase may recur less frequently.
Scientists use listening, spectrograms, and established labeling criteria to identify the target pattern. A spectrogram displays how sound frequency changes over time and can help distinguish one vocal unit from another.
Consistent identification is essential. If researchers count slightly different sounds as the same unit in one recording but treat them as separate units in another, the resulting rates may not be comparable.
3. Measuring the Time Between Repetitions
One straightforward method is to measure the interval between successive occurrences of the same recognizable event.
Suppose a unit begins at 5 seconds and the next occurrence begins at 9 seconds. The interval between their start times is 4 seconds.
Researchers can repeat this measurement across a recording to determine whether intervals remain similar or vary.
For repeated events with approximately regular timing, the rate can be estimated from the average interval:
Repetition rate = 1 ÷ average interval in seconds.
For example, if the average interval between successive repetitions is 5 seconds, the corresponding rate is 0.2 repetitions per second, or 12 per minute.
This method works best when the target events are clearly identified and the interval is measured consistently. When repetitions are irregular, researchers should report the variation rather than implying that the singer follows a perfectly regular rhythm.
4. Counting Repetitions Over a Fixed Time Window
Another method is to count the number of occurrences within a defined period.
Researchers might select a 30-second or 60-second sample and count every occurrence that meets their criteria. They can then divide the count by the length of the observation window.
For example, if a clearly identified unit occurs 15 times in 30 seconds, the observed rate is 30 repetitions per minute.
The chosen window must be appropriate for the behavior being measured. A very short sample may not represent the broader singing pattern, while a very long sample may include changes in phrase structure or extended pauses.
Scientists should also establish how to handle events that begin before the observation window or end after it. Consistent rules reduce counting errors and improve comparisons between recordings.
5. Using Spectrograms to Locate Repeated Units
Spectrograms help researchers visualize recurring acoustic patterns and locate their positions in a recording.
A spectrogram typically shows time along the horizontal axis and frequency along the vertical axis. The intensity of the recorded signal is represented by variations in visual strength or color.
When a recognizable sound repeats, similar shapes may appear at different points along the time axis. Researchers can mark those occurrences and measure the intervals between them.
However, not every visually similar pattern represents the same vocal unit. Different sounds may share some acoustic features, and recording noise can obscure important details.
Scientists therefore combine spectrogram inspection with listening and clearly defined classification criteria. The visual display supports the analysis but does not eliminate the need for careful interpretation.
6. Distinguishing Unit Repetition From Phrase Repetition
A major source of confusion is the difference between a repeated vocal unit and a repeated phrase.
A phrase may contain several individual sounds. Those sounds may occur repeatedly within the phrase, while the phrase itself returns at longer intervals.
Consider a hypothetical sequence in which a whale produces four short units followed by a pause, then repeats the same sequence. Researchers could measure at least three different things:
- The rate at which individual units occur.
- The time between successive phrase beginnings.
- The number of complete phrases produced per minute.
All three measurements can be useful, but they answer different questions.
For a meaningful comparison, an article or research report should explain which level of repetition is being measured. Without that definition, two reported rates might appear contradictory even though they describe different parts of the song.
7. Accounting for Pauses and Irregular Timing
Humpback whale songs do not necessarily follow a perfectly uniform schedule. A singer may repeat a unit several times, pause, and then continue with another phrase.
These pauses affect how researchers calculate repetition rates.
A rate calculated across an entire recording includes periods when the target unit is not produced. A rate calculated only during active sequences measures the pattern differently.
Neither approach is automatically correct for every research question. The appropriate method depends on whether scientists want to describe overall output during the observation period or the pace of repetition while the unit is actively being produced.
Researchers should document how pauses are handled so readers can interpret the results accurately.
They should also avoid assuming that a pause represents a deliberate change in communication. It may be part of the song's normal structure, a temporary break in singing, or an interval during which the target sound was not detected.
8. Using Software to Improve Measurement Consistency
Acoustic analysis software can help scientists inspect recordings, display waveforms, generate spectrograms, mark vocal events, and calculate intervals.
For long recordings, automated detection tools may help identify possible occurrences of a target unit. These systems can reduce the amount of material researchers need to inspect manually.
However, automated detections can contain errors. Background noise may be mistaken for a whale sound, and overlapping vocalizations may cause genuine events to be missed.
Researchers should therefore check automated results against the original recordings and assess how well the detection method performs.
Consistent software settings and documented measurement procedures also help ensure that differences between samples are not simply caused by changes in the analytical process.
9. Comparing Repetition Rates Between Recordings
Once repetition rates have been calculated, researchers can compare recordings collected at different times or under different conditions.
They might ask whether a particular unit is repeated at a similar rate across multiple sessions or whether the observed rate varies during a recording.
Comparisons require consistent definitions of the target event, observation window, and treatment of pauses. Researchers must also account for differences in recording quality and the possibility that different singers contributed to the samples.
If the recordings come from different whales, a rate difference cannot automatically be attributed to an individual preference or communication strategy. Other factors may influence the pattern.
A sound comparison describes what the data show; explaining why a difference occurs requires further evidence.
10. Understanding Measurement Uncertainty
No measurement method is completely free from uncertainty.
A sound may be difficult to distinguish from background noise. The exact beginning of a vocal unit may be ambiguous, or two units may overlap. Different researchers may also disagree about how a complex phrase should be divided into smaller components.
Scientists can reduce these problems by establishing clear definitions, using repeated measurements, documenting uncertain events, and checking a sample of recordings independently.
When the data do not support a precise count, researchers should acknowledge the uncertainty rather than report an overly exact rate.
They should also distinguish the precision of a calculation from the strength of the biological conclusion. A rate can be calculated accurately from a recording without revealing why the whale produces that pattern.
11. Can Repetition Rate Explain What a Whale Is Communicating?
Repetition rate describes the timing of a vocal pattern, but it does not by itself reveal the purpose of that pattern.
A difference in rate might be associated with song structure, the stage of a singing sequence, or other aspects of vocal behavior. Establishing a functional explanation requires additional evidence.
Scientists may need to combine acoustic analysis with observations of behavior, social context, and changes over time.
It would be premature to assume that a faster repetition rate always indicates excitement, aggression, or a particular message. Such interpretations require evidence that connects the measured acoustic feature with the proposed meaning.
Careful research separates measurable sound characteristics from hypotheses about their function.
12. Studying Whale Song Repetition in Samaná Bay
Samaná Bay is a recognized seasonal destination for observing migrating humpback whales. A research project in the region could investigate repetition rates by collecting suitable underwater recordings during documented observation periods.
Researchers could identify recurring vocal units, measure their timing, calculate rates over defined windows, and compare results across recordings.
They would need to account for boat noise, overlapping singers, incomplete recordings, and uncertainty about which whale produced a sound. Longer recordings and repeated sampling could help determine whether an observed pattern is consistent or limited to one session.
Any claims about local repetition rates would need to come from verified acoustic data. Without such data, scientists and publishers should not present hypothetical measurements as established findings about Samaná Bay.
For visitors, the broader lesson is that whale songs contain measurable temporal patterns that scientists can study even when the vocal behavior is invisible from the surface.
Conclusion
Scientists measure humpback whale song repetition rates by identifying recurring vocal units or phrases, counting their occurrences, and measuring the time between them or across a fixed observation window.
Spectrograms and acoustic software help locate repeated patterns, while consistent definitions and quality checks reduce measurement errors. Researchers must also distinguish unit repetition from phrase repetition and explain how pauses and recording gaps are handled.
These measurements provide useful descriptions of whale vocal behavior, but repetition rate alone cannot establish the meaning or purpose of a song.
For those interested in Samaná whale watching, studying repetition rates reveals another dimension of humpback whale communication and shows how careful acoustic analysis can turn underwater sounds into useful scientific evidence.

Local explorer & expert guide in Salto El Zumbador.